PyNano
PyNano is a nanopore data analysis interface, which can be used to analysis the data of bionanopore, solid-state nanopore and similar kinds of pulse signal.
In this project, the UI is using the PyQt5(branch pyqt5) or Pyside2 (Branch master). The data processing is using the numpy, scipy, sympy, nptdms, pandas and sklearn. The data visualization is using matplotlib.
Installation
Note: no .exe build will support any more.
For Windows:
The recommended install method for branch master
- install the miniconda (py38)
- Conduct the commend
pip install -r requirements.txtto build the pynano runtime
If you use Anaconda3, please using the branch pyqt5.
- Install the python >3.5 and add the python into the environment variable.
Anacondas is recommended.
Install the git bash for windows.
-
Download the source file. Direct download the .zip file or using the git clone. Git for windows is needed.
git clone https://github.com/decacent/PyNano.git -
Run. Double click the file pynano.sh or run following command
python pynano.py
For Linux and Mac:
Just build the python development environment and run pynano.py
If you don’t konw how to do it. Please throw your mac laptop into trash and go back the fuck windows.
PyNano interface
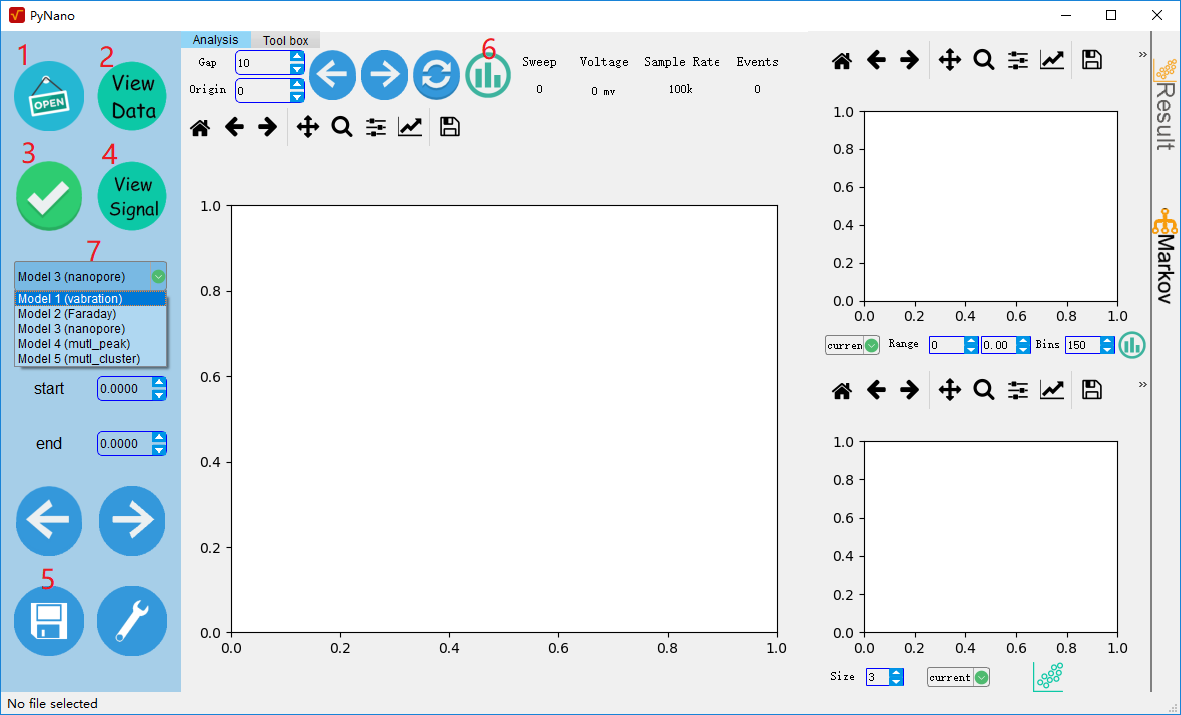
Button function
1: Open the file,this software only support the file of .abf > 2.0 acquired from axon instrument. The api support the array data of numpy.
2: preview the original data.
3: setup the parameters and start the analysis
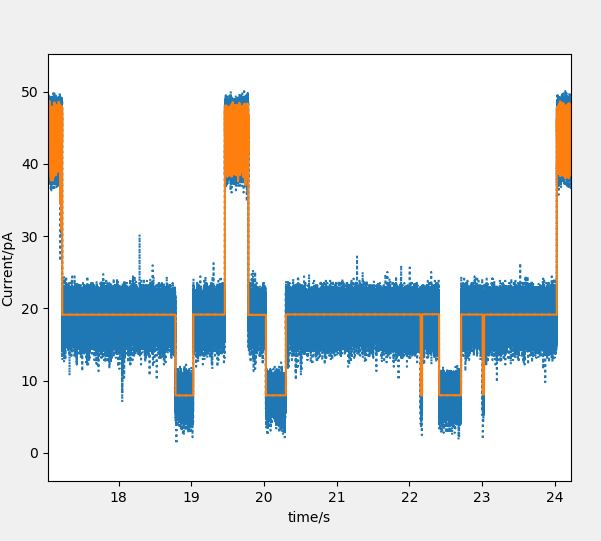
4: preview the fitting result.
5: save the analysis result, supporting the .mat and .csv format.
6: Plot the histogram of original data.
7: select the analysis method.
All the data view window is using the matplotlib. So the button function is the same with it.
Analysis method
Mode 1:vabrication. This method is used for long time, mult-stage signal.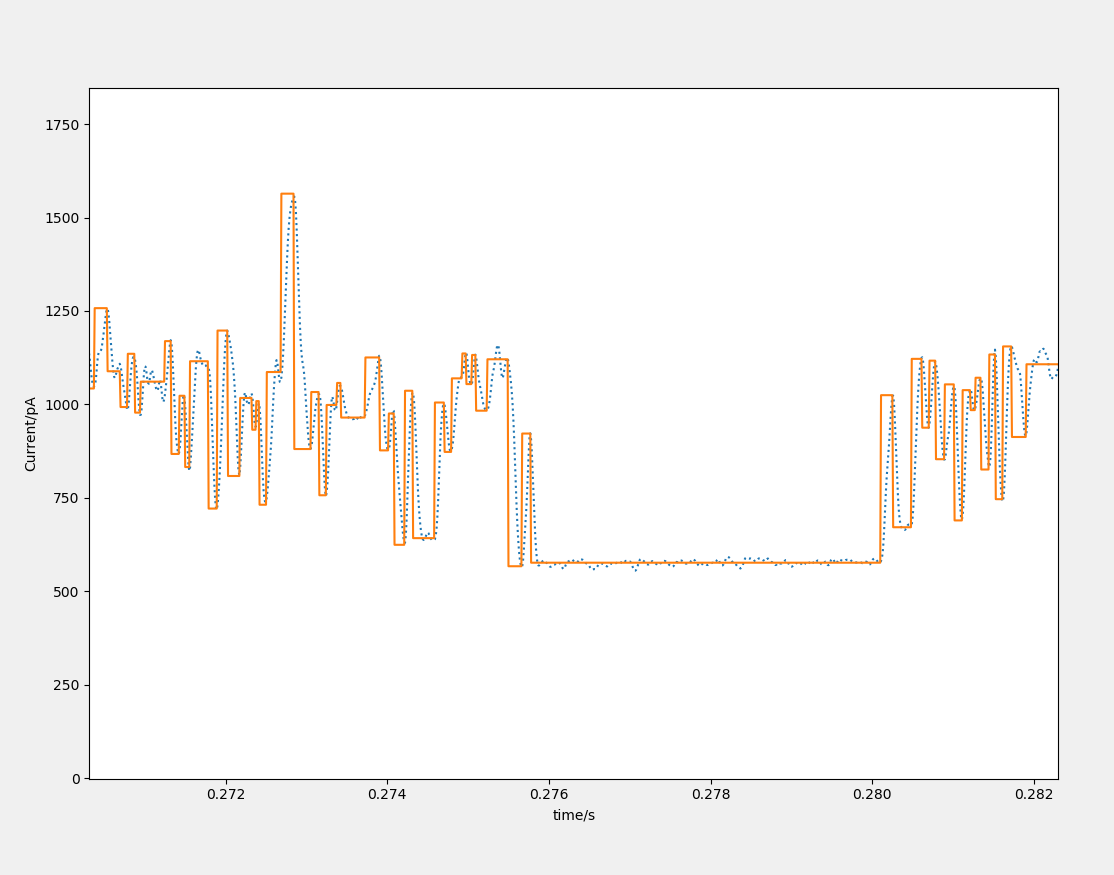
The parameter noise(RMS) is need: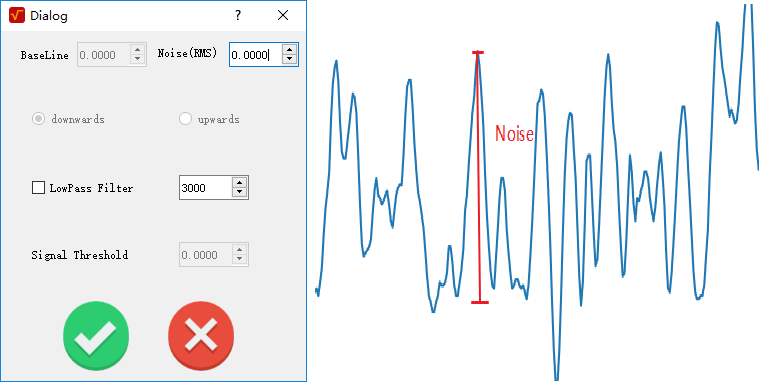
Mode 2: Faraday. This method is only suited to the signal result from Faraday current.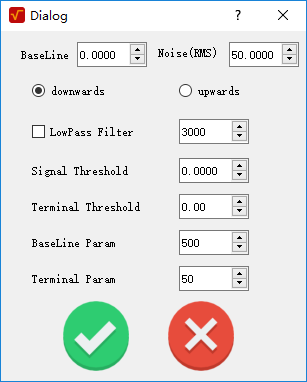
The explain of the parameter please see the annotation of the function collision_analy in pynano/analysis/scat_analy.py
Mode 3: nanopore. This method is used to fit the single-peak signal of nanopore. 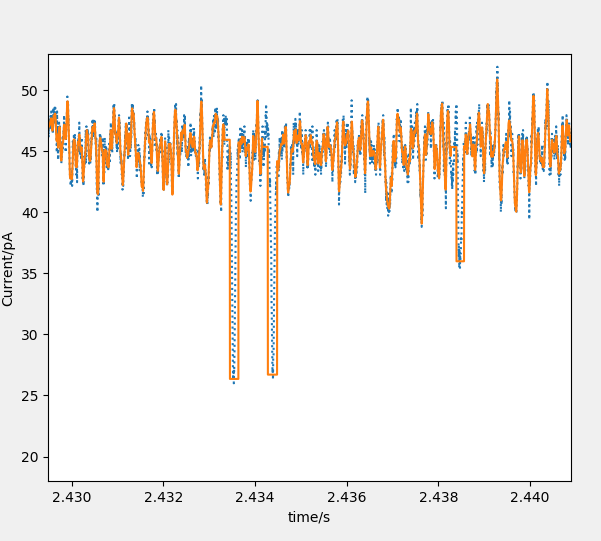
Mode 4: mutl_peak. Fit the mutl-peak signal of nanopore.
Mode 5: mutl_Cluster. Fit the mutl-peak signal of nanopore using the Cluster methods.
Mode 6: pointsaltation. Fit the single-peak signal of nanopore automaticly.
API
File IO
read the .abf > 2.0 file.
from pynano.analysis import axonio
f = axonio.Abf_io('file_name')
header =f.read_header()
data = f.read_abf()
Analysis
For example: mode 3
from pynano.analysis.scat_analy import signal_extract2
help(signal_extract2)
result, fit_data = signal_extract2(init_time, data, peak_th, base, th=100, sam=100000, filter=3000, is_filter=False, is_up=False)